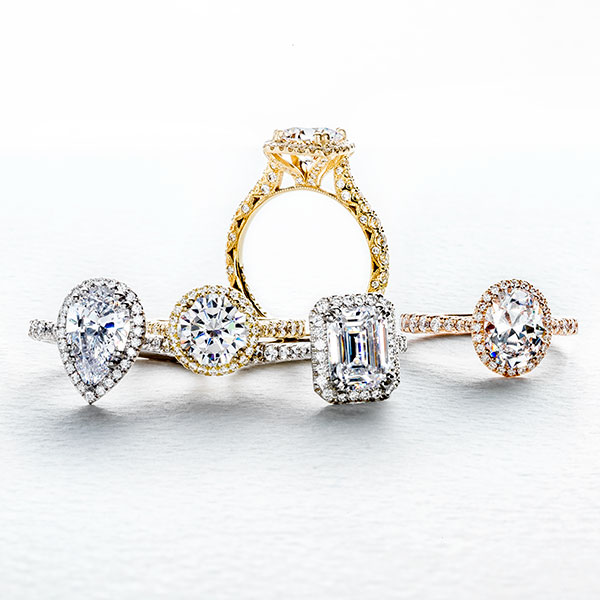
With 21,000 respondents, The Knot’s biennial Jewelry & Engagement Study offers a gold mine of intelligence on recently engaged couples ages 25 to 34. We cherry-picked the best ring-related findings so you don’t have to.
If you haven’t been on the dating circuit in a while, one figure from wedding planning website The Knot’s 2019 Jewelry & Engagement Study may surprise you: At 22%, a plurality of respondents met on dating apps (up 5% from 2017)—namely, Tinder (30%), OkCupid (14%), and Bumble (13%). As if to put an exclamation point on that, the study also found that 92% of couples share the news of their engagement on social media. The upshot for jewelry retailers? Make sure you’re on the ’Gram and your clients know how to tag you. For other top-level takeaways, see our highlights.
THE CENTER STONE
• 66% of center stones weigh 0.5–1.5 ct.
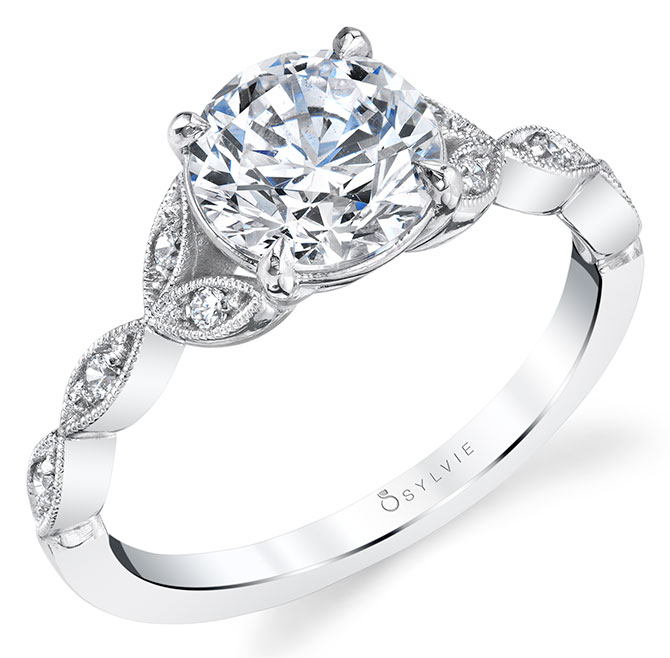
• 52% of brides say they want to buy conflict-free diamonds
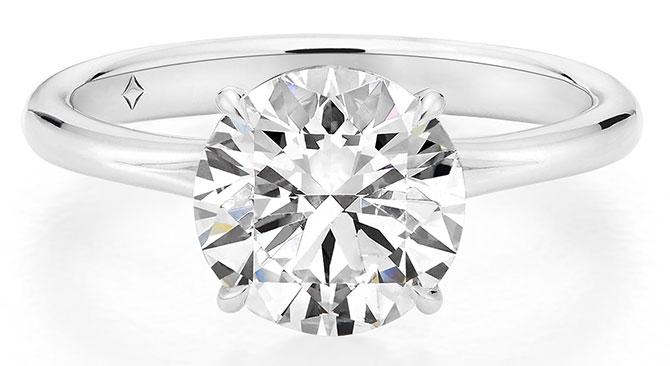
• 47% of center diamonds are round
• Princess-cut, square, and oval diamonds all rank at 14%
• Ovals have doubled in popularity since 2017
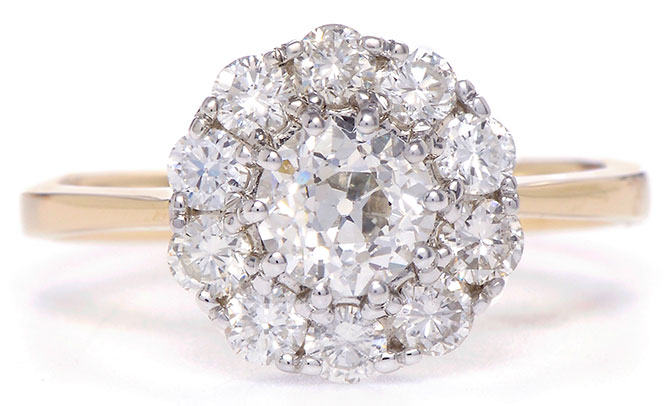
• 7% of couples are resetting heirloom diamonds
• 1 in 10 couples wants a non-diamond center stone
• Moissanite: It’s the most common center stone after diamond (19%), and it has almost doubled in popularity since 2017. Sapphire (18%) and morganite (12%) are also big bridal choices.
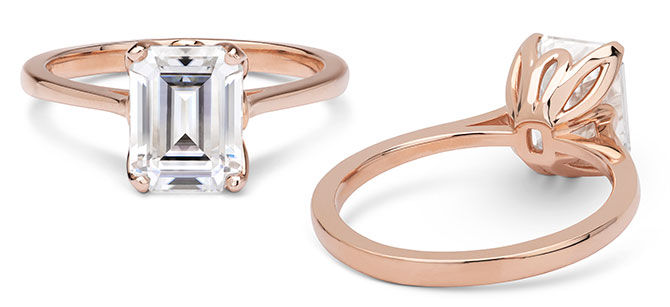
• 15% of brides say they want a man-made stone, but only 12% report receiving one
THE RING
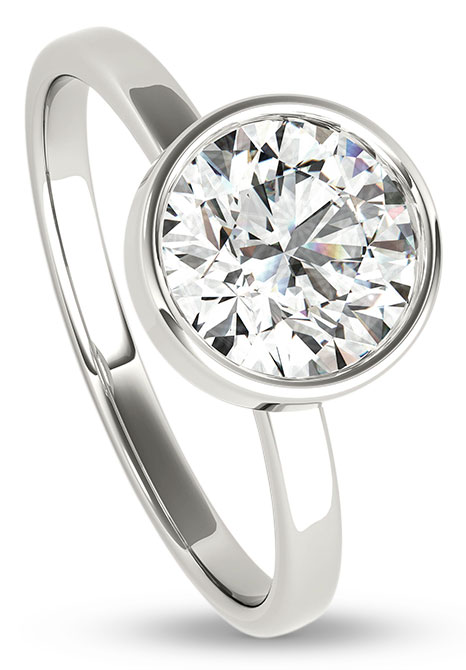
• The overall design of the ring is more important to brides than stone cut and size
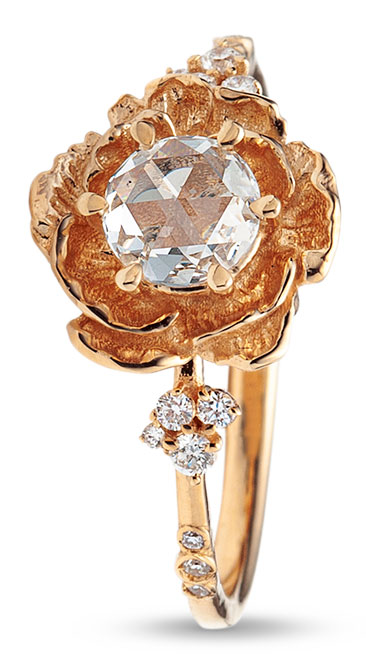
• For style advice, proposers are more likely to rely on friends and family (34%), consult jewelry design websites (32%), or hit up a local brick-and-mortar jewelry store for ideas (29%)
• 78% of proposers say their significant other dropped hints about ring preferences
• 53% of brides relied on Pinterest for ring design research and inspiration
• 31% of couples are custom-designing a ring from scratch
• More than 50% of couples want to personalize their ring design in some way
• White gold settings are overwhelmingly the most popular (54%) but less so than in 2017 (64%)
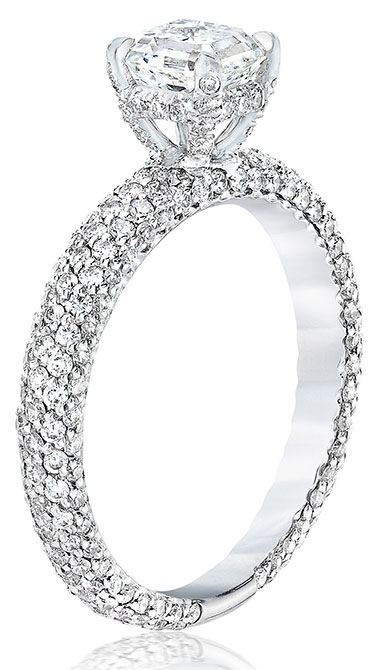
• Rose gold settings are the second most popular (14%), slightly outpacing both platinum (13%) and yellow gold (13%)
• Over the past 5 years, the preference for yellow gold has more than doubled
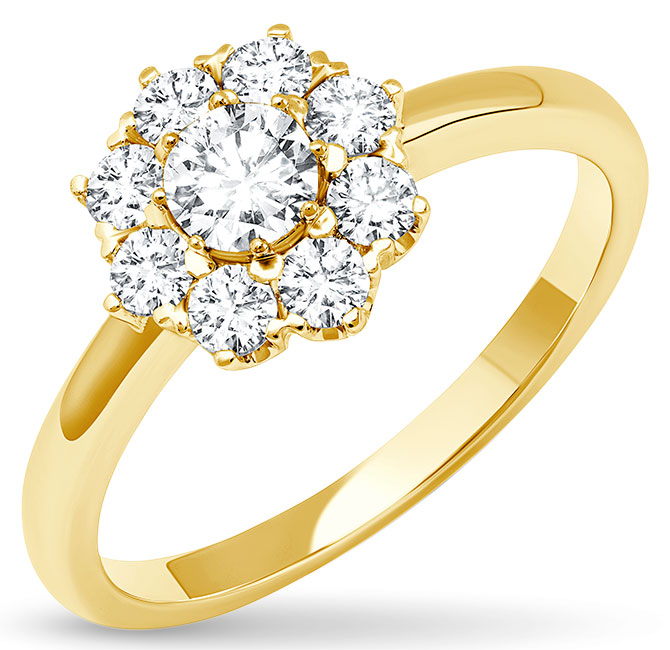
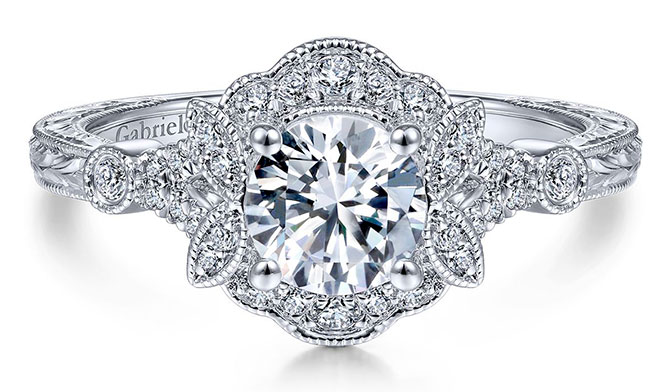
• Halos are dipping in popularity: 24% of respondents reported getting a halo or a shared prong setting engagement ring, down 2% since 2017
SHOPPING
• 90% of proposers purchased the setting and center stone at the same retailer
• Online shoppers were motivated by the promise of better prices or convenience—or just found what they wanted while browsing and went for it
WHERE THEY BUY
40%: Local/independent jeweler and/or retailer
30%: National/regional jewelry chain
11%: Online retailer
• 7 in 10 brides say they were somewhat involved in selecting or purchasing their ring; 23% (nearly a quarter) of that group say they looked at rings with their partner
• How quickly can you and your vendors deliver? 39% of proposers purchase the ring 1–2 months before proposing.
• 3: That’s the average number of retailers proposers visit before purchasing an engagement ring
• More than 70% of those proposing say it’s important to see the ring in person before purchasing and, on average, look at 15 rings as part of their search
• The top 3 online retailers: Blue Nile, Brilliant Earth, James Allen
• The top 3 national chains: Kay Jewelers, Zales, Jared
SPENDING
Average engagement ring cost by region:
Mid-Atlantic: $7,500
New England: $6,900
Southwest: $5,600
West: $5,500
Southeast: $5,400
Midwest: $5,300
32%
Proposers want a good deal on the engagement ring, or at least a fair deal. Not knowing either way was listed as the top concern.
27%
Proposers’ second biggest concern? Not understanding enough about diamond terminology.
26%
Proposers also worry about finding retailers with options they can afford
• 1 in 3 proposers spends $1,000–$4,000 on the ring
• The national average cost of an engagement ring in 2019: $5,900, down from $6,351 in 2017 (compared with $5,095 in 2011)
• 72% of couples have purchased or are planning to purchase insurance for their engagement ring
• 20% of proposers discussed the cost of the engagement ring with their partners in advance. and they’re standing firm: 7 in 10 report sticking to their budget at purchase time.
WEDDING BANDS
• White gold is the top metal preference among women (52%), down from 61% in 2017
• Rose gold (15%) and yellow gold (11%) are trending up
• Average cost of a man’s wedding band: $510
• Average cost of a woman’s wedding band: $1,100

• Platinum holds at 10%, down from 12% in 2017
• Tungsten is still the most popular metal among men (23%); white gold is a close second (21%)
Top: RoyalT Petite Crescent Bloom Varietal collection rings, $3,495–$5,145 (without center stones), tacori.com